
Is there a report you use (or want to use) often? Make your PowerBase homepage way more useful by adding the reports that you need to see right to your PB homepage, also known as the dashboard.
If there is data you want to have right at your fingertips each time you log in to PowerBase, create a report and enable it as a dashlet.
Here are the steps to create a report that can be used as dashlet:
- Click Reports > Create Reports from Templates
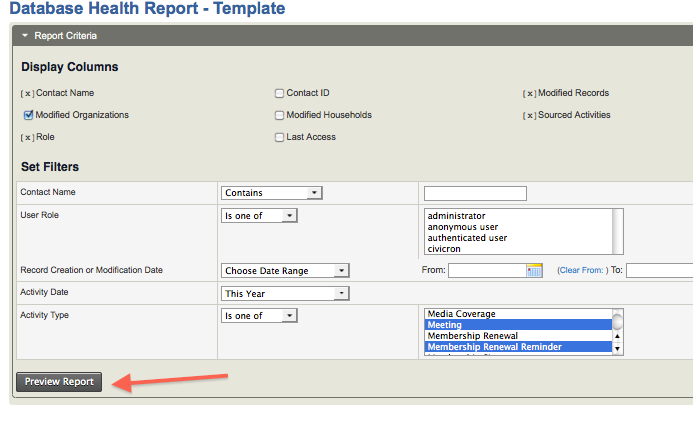
- Select the report that you want to see on your dashboard.
- Choose the criteria you want to look at in your dashlet.*
- Click Preview Report.
- Once there, click Create Report.
- At the bottom of the Create Report section, there’s a checkbox that says “Available for Dashboard?”
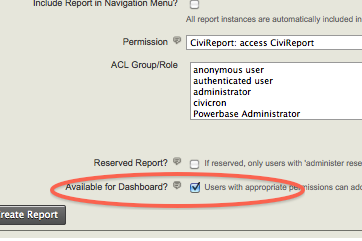
- Click it, and users with permission to see that information (i.e. if it’s about events, users who have permissions to see event-‐related stuff) will be able to add that dashlet.
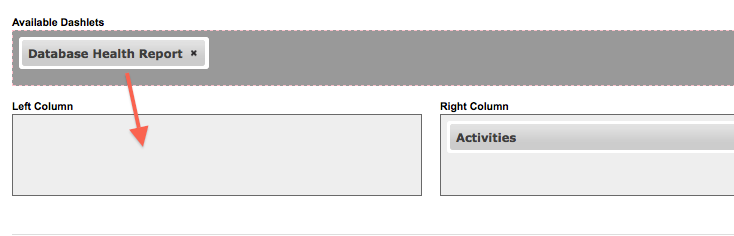
- Once you’ve enabled the dashlet, click Home.
- Click Configure Dashboard. Drag the dashlet from the “Available Dashlets” box to the column where you’d like it to appear.
Once you can view the report on your dashboard, you will have the latest info at your fingertips. If you suspect any data isn’t up to date, just click Refresh Dashboard Data at the top right of the dashboard.
Read more about the dashboard and dashlets in the manual.
Category:
Learning Powerbase
Organizing with Powerbase
PowerBase - General
Reports